
2011 H1 Restaurant Ad Spending Up 10%
By: Jim Boyle
Appetizer: Spicy Spuds from Spago; Wine choice: ’04 Cowboy Cabernet
2011 Restaurant ad spending for the first six months was over $607 million in the Top 12 markets, or a 10% increase over the prior year. This highly economically-sensitive advertising category was considerably less delicious in the first half (H1) of 2010 when it was down 9% in the Top 12 markets. This is logical during the recession; but 2011 spending almost exactly matches 2009 spending (also over $607 million). The two notable trends for Restaurants were: they continued to dramatically spend on TV, and, in the last few years, the Dallas & Atlanta markets’ Restaurant ad spending has soared to become the #3 & #4 ranked markets respectively, nearing #2 NYC, but still way behind the ravenous Restaurant mavens in #1 Los Angeles. Pass the Spago spuds.
Salad: White Truffles on Arugula; Wine Choice: Proud Piedmont in Little Italy
The overall Restaurant ad spending through the first six months was a hefty $1.087 billion versus the prior year’s $995 million, almost a 10% increase. Restaurants continually reminded us all to enjoy eating out with over 8.94 million spots in H1 2011 compared to 8.31 million advertisements in H1 2010 for a 7.6% increase as per Media Monitors’ comprehensive data.
The hottest Restaurant markets have been shifting of late. The #3 and #4 TV markets are Chicago and Philadelphia, but no longer are they for Restaurant ad spend. Dallas has ridden the backs of more than just its popular steakhouses as it provides all the global cuisines, just as Atlanta has long gone beyond classical southern cuisine, a necessary move when the USA population shifted south. Restaurants, family fare and haute cuisine, have taken notice and followed with their advertising wallets [markets ranked by total Restaurant ad spend].
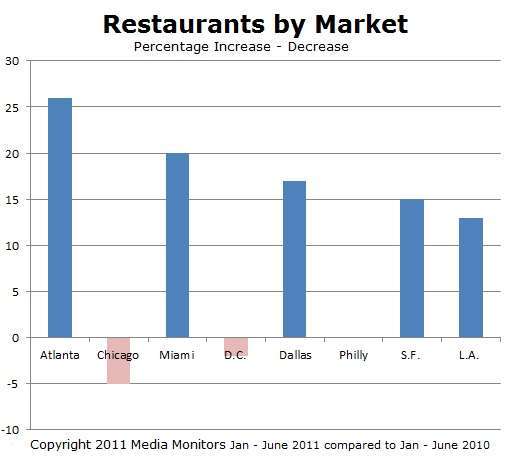
| #4 Atlanta | up 26% to $54.5MM |
| #5 Chicago | down 5% to $46.7MM |
| #9 Miami | up 20% to $30.2MM |
| #8 D.C. | down 2% to $31.2MM |
| #3 Dallas | up 17% to $64.9MM |
| #12 | flat at $22.2MM |
| #7 San Fransisco | up 15% to $33.2MM |
| #1 Los Angeles | up 13% to $162.5MM |
Soup: Southern Drawl Bisque; Wine Choice: Silky ’97 Pinot Noir by Coppola
The extensive advertising database compiled by Media Monitors, a leading research company that tracks Television, Newspapers, Cable TV and Radio advertising and programming details, revealed in 2011 that Restaurant advertising was very uneven by media. The best performer in H1 2011 was Television stations with a 16.4% increase in the Top 12 markets. The weakest performer in H1 2011 was Newspapers that were off 21.1%, after last year’s best H1 when they jumped like a jalapeno-fired flea (up32.0%). By comparison, local Television stations, local Radio stations and local Cable systems all were off in H1 2010 vs. 2009, and then rebounded to be up in H1 2011. Newspapers soared in 2010 and subsequently gave it back in 2011 as though they needed to rush home to avoid the take-out delivery person impatiently waiting in the driveway.
| TOP 12 MarketsNets | 2010 H1 | 2011 H1 |
| Restaurant Ad REVENUE % yr./ yr. | $ 552 million | $ 608 million up 10.0% |
| Restaurant AD Spots % yr./ yr. | 2,035,000 spots | 2,101,000 spots up 3.2% |
What the highly detailed Media Monitors ad information discloses is the faster Restaurant ad revenue surge in 2011 to-date is a profitable combination of more ad spots sold and sold at higher rates. Media Monitors local media detail, seen below as ranked by revenue, revealed that Restaurant ads have definitely dined out the most with a voracious appetite for TV with both substantial revenue and ad rate improvement in 2011. All three media saw their average telecom restaurant advertising rates increase in 2011 YTD.
| 2010 H1 | 2011 H1 | |
| TV Station Rev. [12 of 46 mkts.] % yr./ yr | $ 396 million | $ 461 million up 16% |
| Avg. Spot Rate % yr./ yr. | $795 per spot | $ 461 million up 16% |
| Newspaper Rev. [12 of 52 mkts.] % yr./ yr. | $ 54 million | $ 42 million down 21% |
| Avg. Ad Rate % yr./ yr. | $10,140 per ad | $11,530 per ad up 14% |
| Radio Station Rev. [12 of 62 mkts.] % yr./ yr. | $ 103 million | $ 104 million up 2% |
| Avg. Ad Rate % yr./ yr. | $131 per spot | $140 per spot up 7% |
Entrée: Lemongrass Crusted Yellowtail a la Rivoli; Wine choice: Schramsberg, Brut Rose
The wide-ranging local data from Media Monitors across as many as 50-85 markets across the different local media also shows that Restaurants ads devoured the most inventory in Cable TV and in Radio in the Top 12 markets so far in 2011.
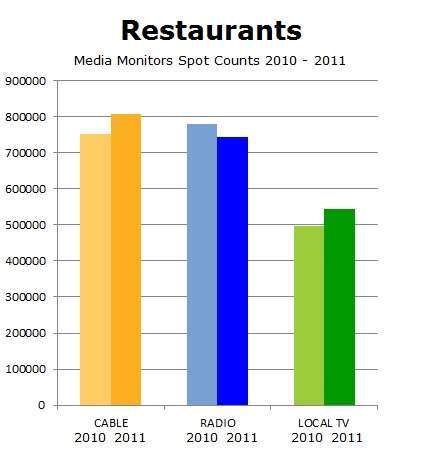
| Local Cable Net Spots % yr./ yr. | 751,100 spots | 807,600 spots up 8% |
| Radio Station Spots % yr./ yr. | 781,000 spots | 744,700 spots down 5% |
| Local TV Station Spots % yr./ yr. | 498,300 spots | 545,200 spots up 9% |
| Local Newspaper Ads % yr./ yr. | 5,300 ads | 3,700 ads down 30% |
Dessert: Hazelnut Crumble Flambé; Wine choice: ’59 Chateau d’Yquem or zesty Brooklyn Egg Cream
Gorging on the Media Monitors database in its Restaurant advertising category trends, which is just one of the hundreds of ad categories tracked by its proprietary methodology, confirms that vital Restaurant marketing budgets for media zoomed in H1 2011, affirming that the economy is recovering, but in spurts. While diners from L.A. to San Francisco, from Miami to NYC relished dozens of cuisines, the knowledgeable Restaurant marketers significantly boosted their ad expenditures particularly on local TV stations, using more expensive Newspaper and Radio ads, as well as placing many more local Cable spots in 2011 to date.